Design Optimized for Statistical Analysis
We develop an analysis plan suited to the objective and data characteristics, including simple tabulation, cross-tabulation, statistical testing, multivariate analysis, regression analysis, and SEM.

E-LINE Co., Ltd.'s Analytics Division provides integrated support from survey tabulation, statistical analysis, qualitative analysis, open-ended response analysis, text mining, and market research through report preparation. We organize research data from universities, research institutions, government agencies, and companies into readable, explainable deliverables tailored to the objective.
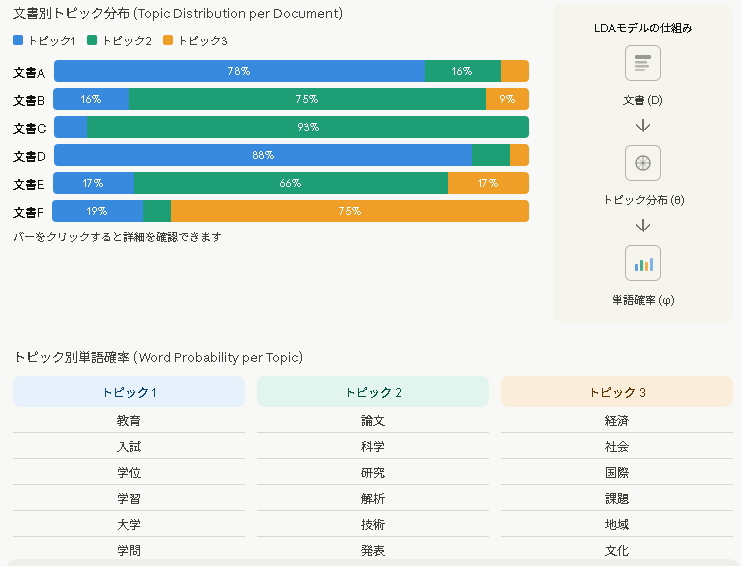
What matters in research and analysis is not simply listing the names of methods. It is essential to clarify what you want to discover, how variables should be handled, and to whom the results will be explained, and then to design the entire process consistently—from research design and data preparation through analysis, visualization, and report preparation. E-LINE Co., Ltd. proposes analysis plans that are neither excessive nor insufficient, tailored to your research objectives and practical challenges.
We develop an analysis plan suited to the objective and data characteristics, including simple tabulation, cross-tabulation, statistical testing, multivariate analysis, regression analysis, and SEM.
We code and categorize open-ended responses, transcripts, and interview notes, organizing them into analytical results that are clear to readers.
We present analytical results clearly in tables, graphs, and text, and organize them so they can be readily used in academic reports, journal articles, internal business reports, and government materials.
For research studies, customer surveys, employee surveys, government and regional surveys, and research in healthcare, education, and welfare, we assemble the required scope of support according to the data type and final deliverables.
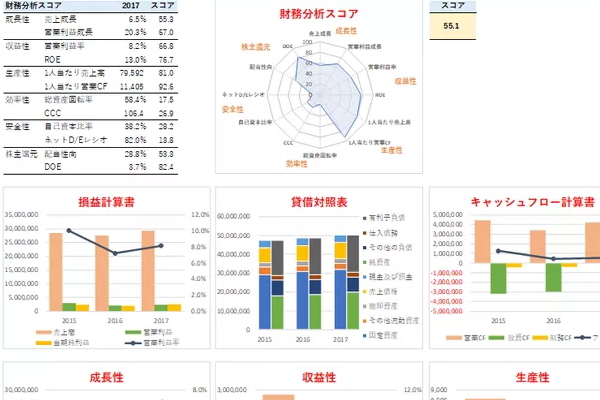
For survey and experimental data, we organize results in line with research objectives and practical questions using descriptive statistics, hypothesis testing, multivariate analysis, regression analysis, factor analysis, structural equation modeling, and other appropriate methods. Selection of analytical methods, checks of assumptions, formatting of result tables and graphs, and drafting of interpretive text can be supported.
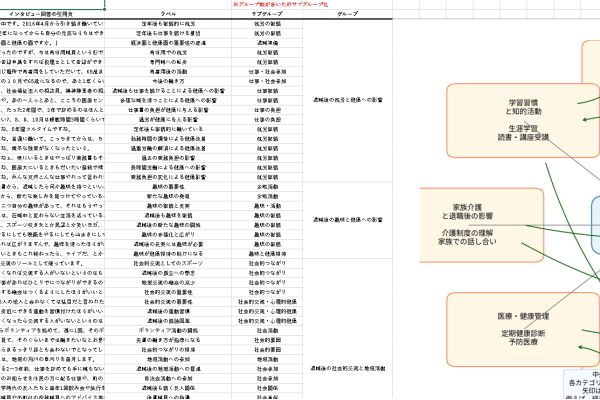
For open-ended responses, interview transcripts, consultation records, and field notes, we organize meaning, perform coding and categorization, and extract themes. Not simply summarizing, but organizing the material with clear analytical procedures and classification criteria is a priority for us.
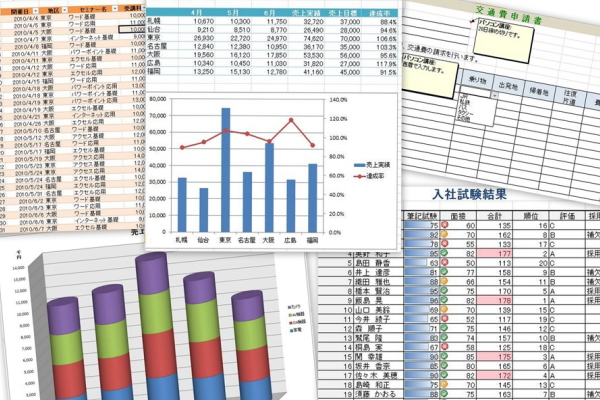
We organize paper questionnaires, Excel data, CSV data, audio or transcribed data, text in images, and other source material into formats suitable for analysis. This includes missing values, inconsistencies in notation, response-option codes, variable names, and category integration, among other tasks, Data Preparation Before Analysis Careful execution makes it easier to recheck and verify the analytical results.

We support research design for collecting information needed for decision-making, including market needs, customer satisfaction, service improvement, product evaluation, employee attitudes, and regional issues. Research objective, target population, questions, response format, aggregation method, and presentation of the report should be considered as an integrated whole.
We select only the analyses needed based on the measurement level of the data, sample size, research hypotheses, and reporting destination. Methods not listed below and partial-scope requests are also welcome.
Descriptive statistics, simple tabulation, cross-tabulation, t-tests, chi-square tests, correlation analysis, and paired/unpaired comparisons.
Multiple regression, logistic regression, discriminant analysis, quantification methods, cluster analysis, principal component analysis, and more.
One-way and two-way ANOVA, repeated-measures analysis, ANCOVA, multiple comparisons, and nonparametric tests.
Path analysis, structural equation modeling, latent-variable modeling, and examination of scale reliability and validity.
Coding, categorization, theme extraction, M-GTA, SCAT, KJ Method, content analysis, and organization of analytical memos.
Frequent-term analysis, co-occurrence networks, correspondence analysis, trend analysis of open-ended responses, and visualization using tools such as KH Coder.
We confirm the purpose of the research or study, the condition of the data, and the required deliverables, then design a feasible analysis plan.
We confirm the research objective, hypotheses, target population, reporting destination, and required submission format.
We check the condition and format of Excel, CSV, SPSS, paper records, transcripts, and other source data.
We organize variables, scales, methods, figures and tables, and the direction of interpretation.
We proceed with tabulation, statistical analysis, qualitative analysis, and visualization.
We deliver in the required format, such as reports, tables, graphs, and analysis memos.
Research results can significantly affect advertising claims and internal decision-making. At E-LINE Co., Ltd., rather than casually creating weakly supported claims such as 'No. 1 in satisfaction,' we review the survey method, target population, questions, aggregation conditions, and appropriate scope of interpretation, and prioritize presenting results in a way that is unlikely to mislead.
We also accept partial requests, such as analysis only, graphing only, questionnaire review only, or report preparation only.
Tabulation, analysis, and visualization for undergraduate theses, master's theses, doctoral dissertations, journal articles, conference presentations, and research-grant reports.
Quantitative and qualitative organization of questionnaire surveys, interview studies, open-ended responses, practice reports, and case studies.
Design, tabulation, and analysis of customer satisfaction, employee attitude, product evaluation, service improvement, and market-needs surveys.
Tabulation and report preparation for regional issues, resident attitudes, user surveys, policy evaluation, and program-effectiveness assessment.
Yes. We review the research objective, hypotheses, target population, scales, response options, aggregation methods, and analytical techniques, and help structure the questionnaire so that it can be analyzed effectively.
Yes. For open-ended responses, interview transcripts, hearing notes, and similar materials, we support coding, categorization, thematic organization, structural diagrams, summary tables, and preparation of text for reports.
Yes. We first review the condition of your data—whether paper-based, Excel, CSV, SPSS, text files, or other formats—and then propose an appropriate scope covering digitization, formatting, and cleaning.
Yes. We can organize tables, graphs, explanations of analytical results, and key points leading into discussion sections in a readable format suited to the intended submission or use.
Based on questionnaires, Excel data, open-ended responses, transcripts, materials to be graphed, and other source files, we explain the necessary scope of work and how to proceed.
Please feel free to contact us using the information below.
